Anomalies are defined as samples that lie at an abnormal distance from other values in the dataset. Anomaly detection (also known as outlier detection) is the process of identifying these observations which differ from the norm. Some use cases for anomaly detection are – intrusion detection (system security, malware), predictive maintenance of manufacturing systems, monitoring for network traffic surges and drops.
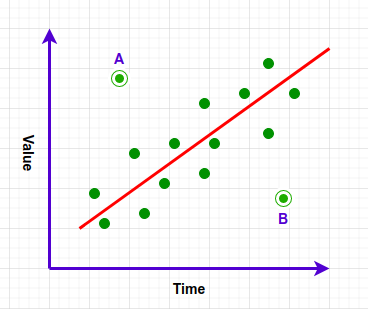
The above image shows variation of an item value over a period of time. The points A and B lie exceptionally far from other samples. Hence they are treated as anomalies. Anomaly detection assumes that anomalies occur very rarely in the data. Depending on the use case and availability of data, anomaly detection consists of 2 types –
Supervised Anomaly Detection – If we have a labelled dataset i.e whether a sample is anomaly or not, we can train a Machine Learning classifier like Support Vector Machine, Random Forest to predict if an unseen sample is anomaly. The advantage of this method is it produces highly accurate results.
Unsupervised Anomaly Detection – In most cases, we don’t have a labelled dataset to train a model. Also, the number of anomalies in the dataset may be very few as compared to non anomalies i.e the classes are highly unbalanced. This article focuses on detecting anomalies in such cases using Machine Learning and statistical analysis.
In this article, we will be using temperature sensor data of an internal component of a large, industrial machine. This is a real world dataset which you can download from here .The dataset comprises temperature readings over a period of 2 months. We have been given that a sudden surge or drop in value may cause a catastrophic failure in the future. Our goal is to detect these anomalies so that preventive measures can be taken immediately to avoid failure of the machine. We will be using the following Python libraries –
Pandas, Numpy – Data manipulation and analysis
Sklearn – Machine Learning in Python
Matplotlib, Plotly – Data Visualisation
Exploratory Data Analysis :
The data is provided as a csv file with 2 columns – timestamp and temperature reading. It is loaded in a dataframe using Pandas library. The data is sampled every 15 minutes and there are 22695 records in all.
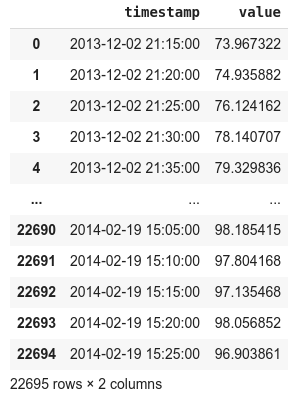
The ‘value’ column is the temperature reading. The next step is to generate descriptive statistics like count, mean, minimum and maximum for the ‘value’ column. This gives us an idea regarding the distribution of values present in the column.
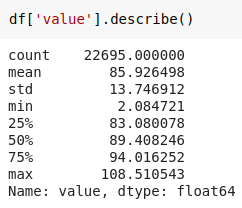
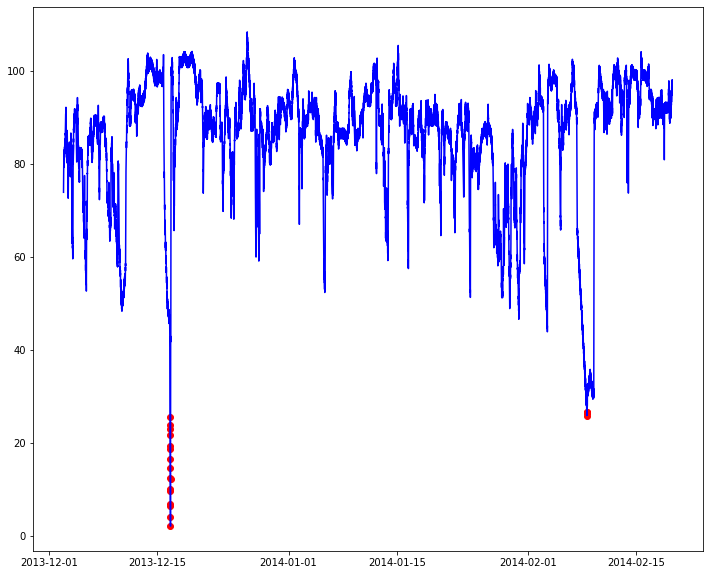
The lowest value of temperature is 2.084721. From the mean and median, we can say that the minimum value may be a sudden drop i.e an anomaly. Next we will plot a graph of temperature over the period of time using Plotly library.
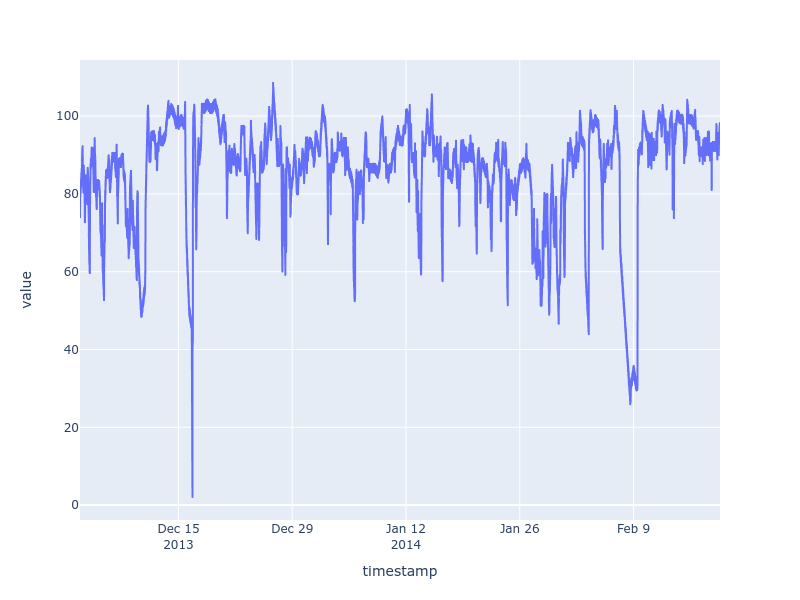
As we can see, around 16th December 2013, there was a steep and sudden fall in temperature. Our goal is to develop a Machine Learning model which will detect such occurrences immediately so that preventive measures can be taken to prevent failure.
Model Training :
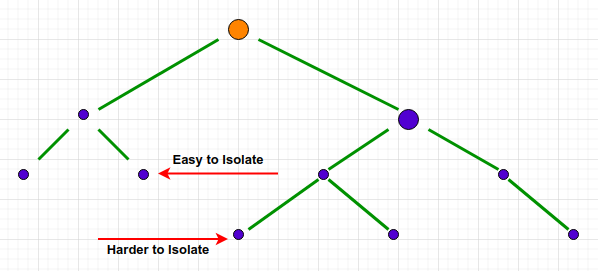
We will first use the Isolation Forest algorithm which is very popular for outlier detection. Isolation Forest is based on the fact that anomalies are data points that are few and different. The Isolation Forest ‘isolates’ observations by randomly selecting a feature and then randomly selecting a split value between the maximum and minimum values of the selected feature. This process is done recursively. The number of splittings required to isolate a sample is equivalent to the path length from the root node to the terminating node. Random partitioning produces noticeably shorter paths for anomalies. Hence, when a forest of random trees collectively produce shorter path lengths for particular samples, they are highly likely to be anomalies.
An important parameter of this algorithm is ‘contamination’ factor. It denotes the amount of contamination in the data set, i.e. the proportion of outliers in the data set. If we do not specify it, the threshold is determined automatically. In our case, we will keep it 0.001 (0.1% of the entire dataset). Next we will visualise the outliers and normal data points using Matplotlib library. The red dots in the figure below denote the anomalies.