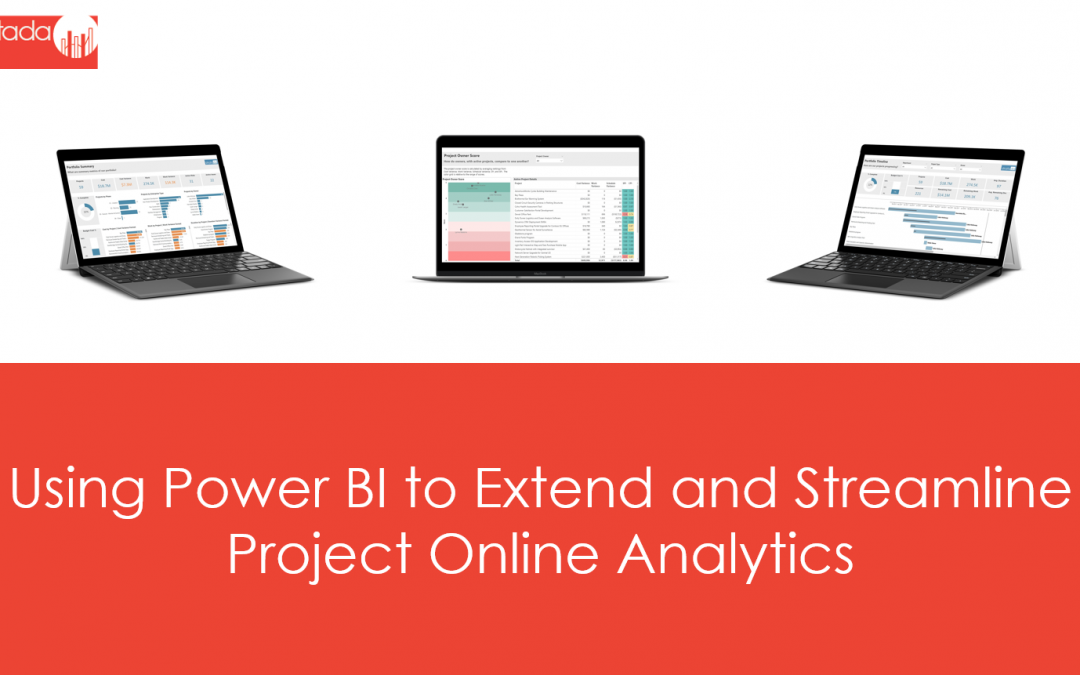
We recently recorded our first webcast on using several key features in Microsoft Power BI to extend and streamline your project analytics (or business analytics, in general). While there are numerous features of Power BI that enable you to perform more advanced analytics, and new-and-improved features are released on a monthly basis, we decided to focus on three unique features: buttons, bookmarks, and drillthrough. We would be remiss not to leverage these in the reports that we develop for clients. They are powerful, dynamic, and impactful. They enable end-users to navigate reports with ease, switch between measures, perform drilldowns on multiple visuals at the same time, mine the data for deeper insights, etc. You get to use your imagination.
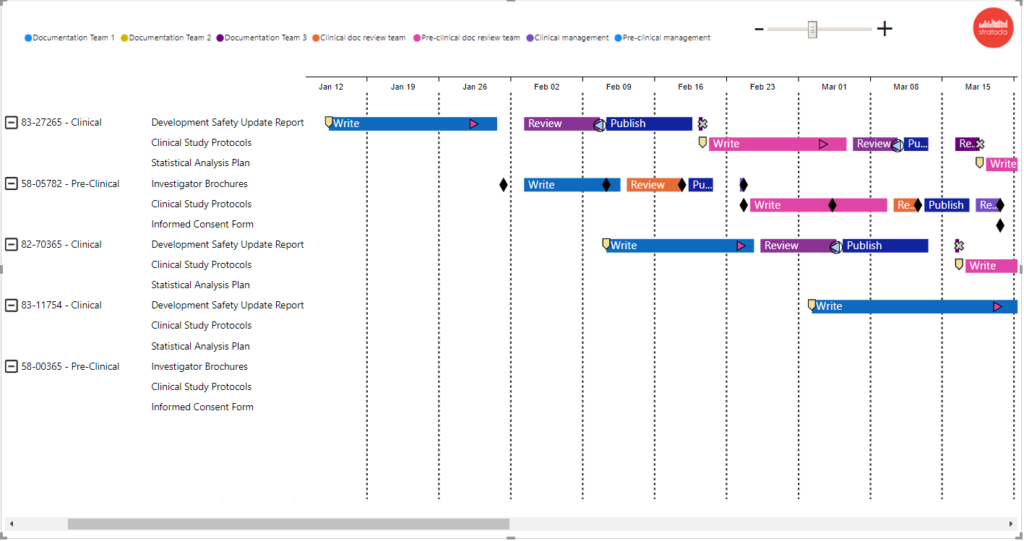
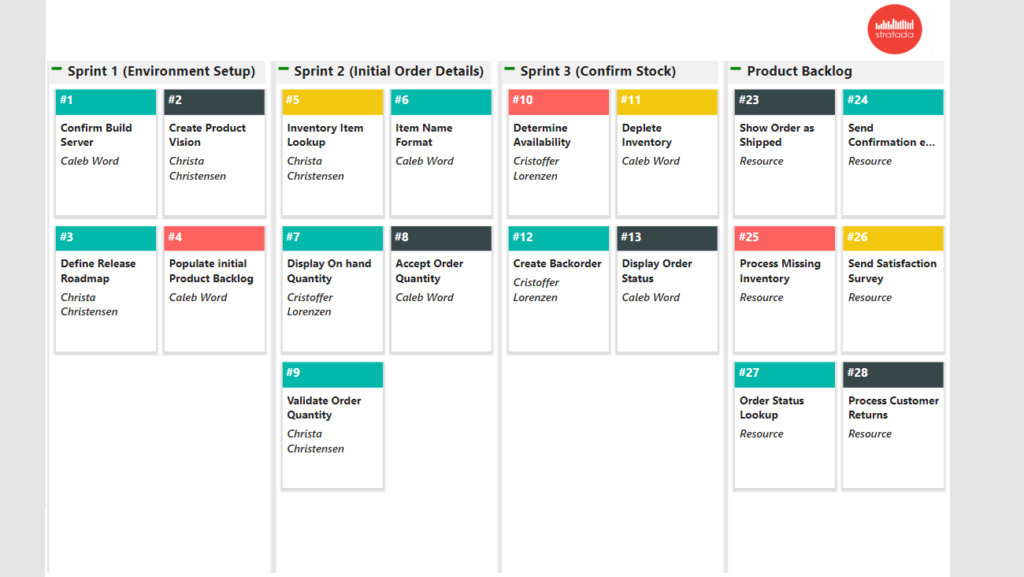
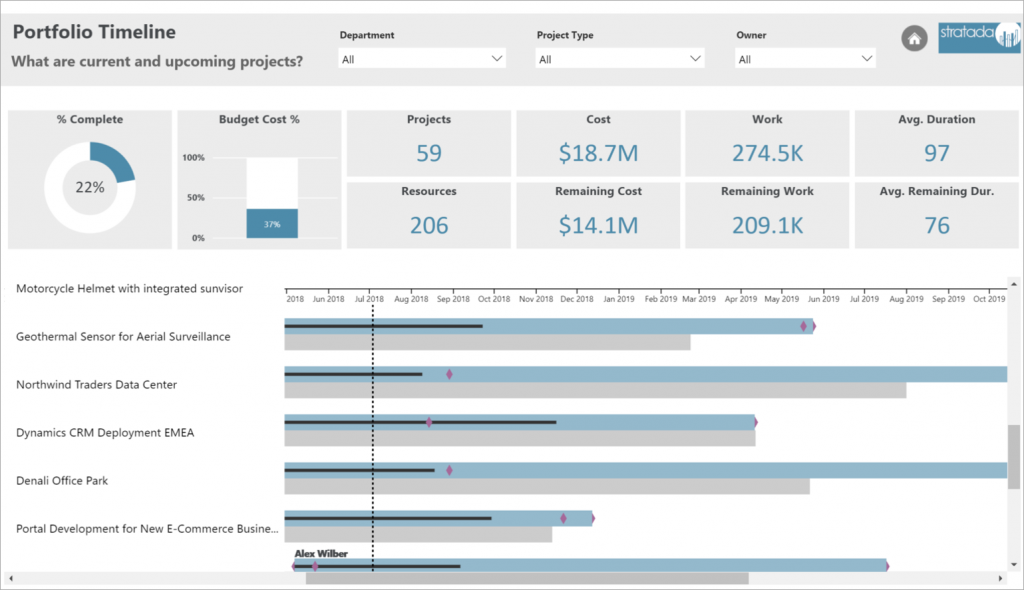
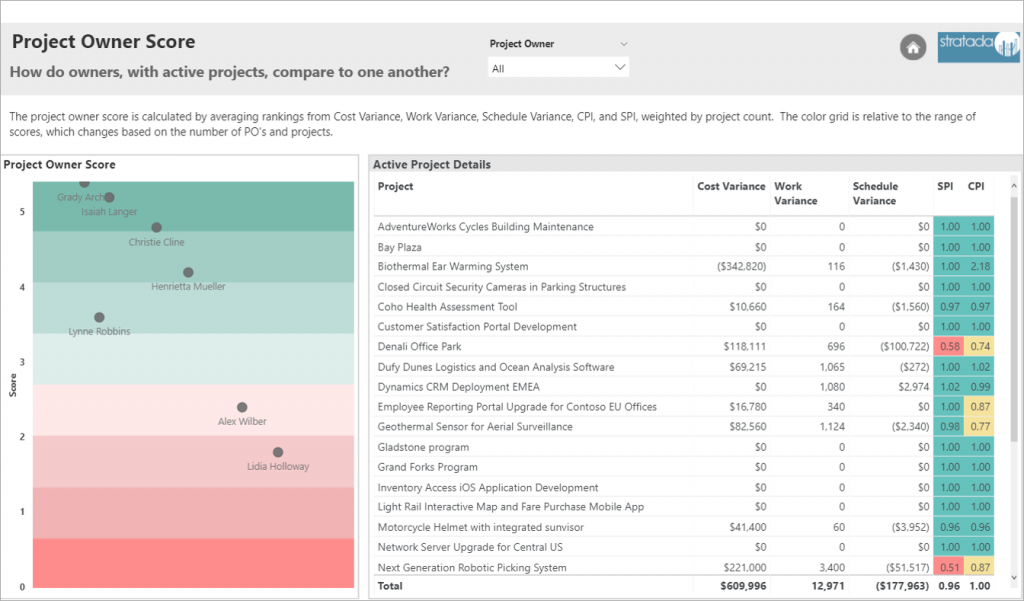
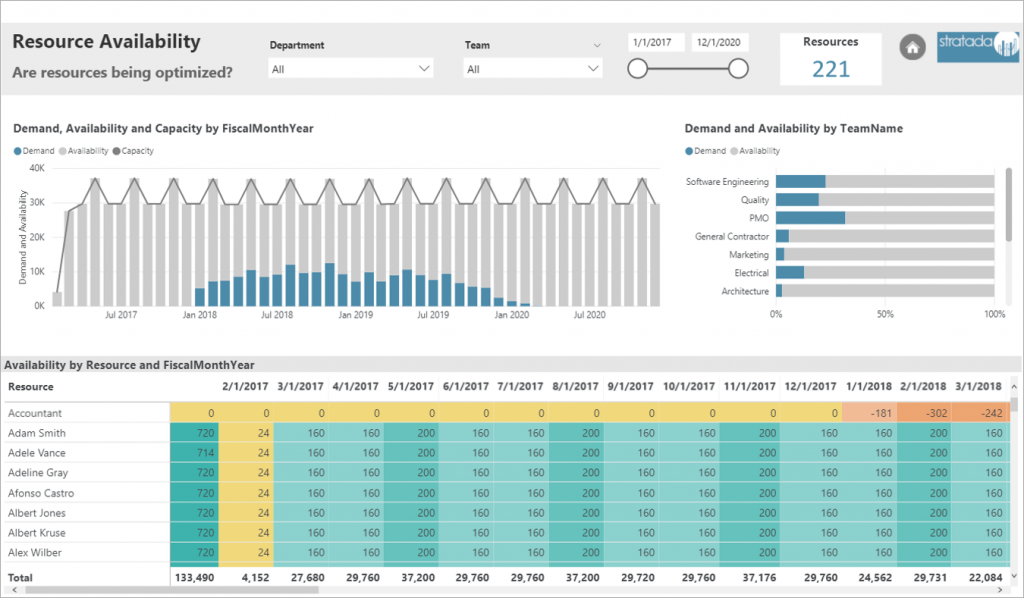
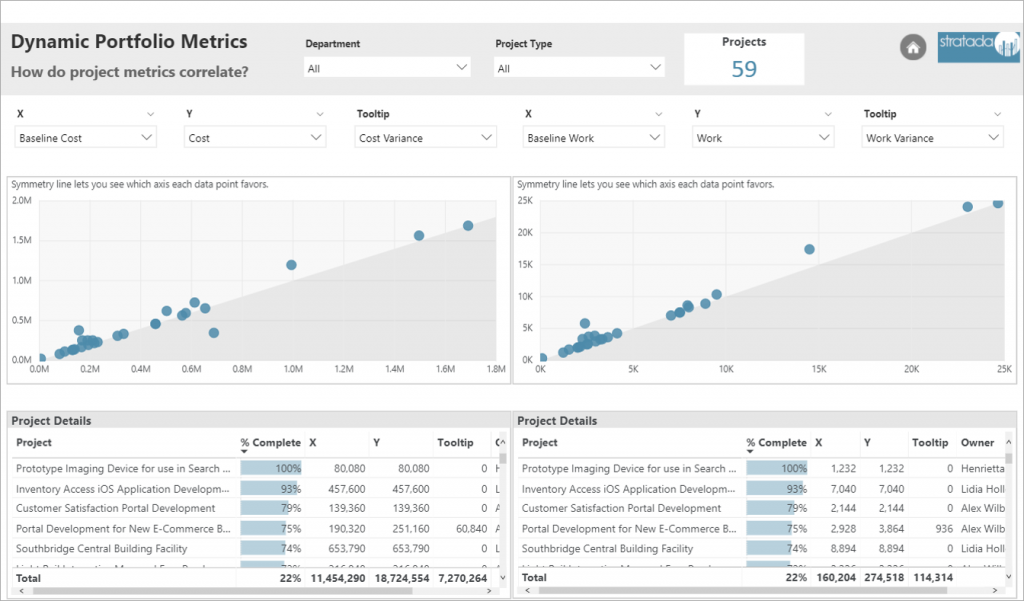
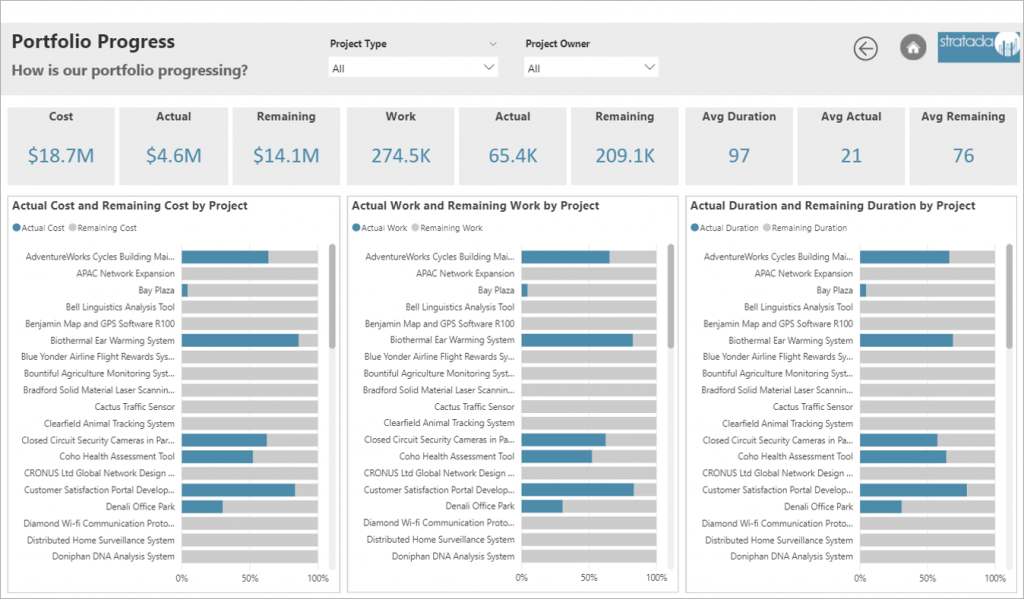
Data from line-of-business applications, such as Microsoft Project Online, can be challenging to explore, uncover hidden stress points, and derive actionable insights. Power BI can immensely simplify this data analytics process. We’ve actually developed a Project Online report pack to do just that.
Below is the recording of our webcast. Not only do we show you how we’ve put these features to use in our report pack, but we subsequently demonstrate how you can implement this yourself on your own set of reports. You’ll learn how to create bookmarks and link them to buttons, as well as configure drillthrough on your reports, enabling the ability to navigate from a high-level view of your data to a more granular view. All of this is performed in Power BI Desktop. Please keep a lookout for future webcasts like this one and let us know if there is something specific you would like us to cover.