Microsoft
MICROSOFT project online REPORT PACKMicrosoft Project Online is the right way to manage portfolios, programs and projects. Let our reports give you the insights you need to stay on time, deliver great quality and manage your resources.
Features Overview
Timely insight of project performance is important for making strategic decisions that could be the determinative factor as to whether or not a project succeeds. Our Microsoft Project Online reports help you stay on top of key performance indicators, analyze project progress, drill into project and resource details, and much more. Additionally, we work with you to develop professional-grade reports that meet the specific needs of your PMO.
Watch Our Report Pack in Action!
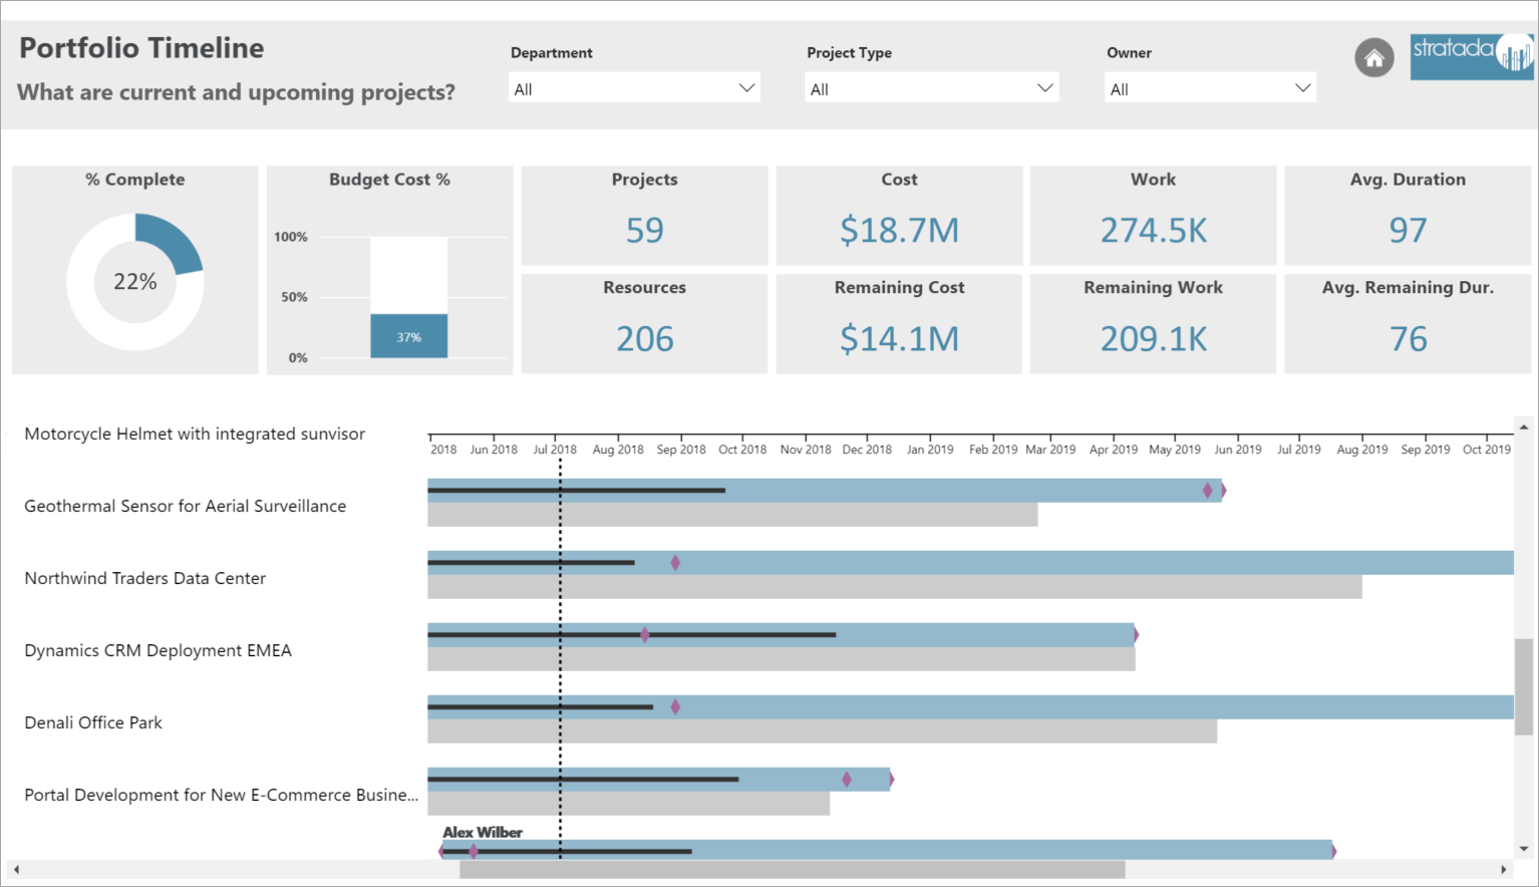
Portfolio Analysis
View key metrics of your entire portfolio. These reports present a summarized view of your data, giving you insight into your PMO landscape, providing necessary context for more detailed analysis. Our custom Gantt chart displays milestones and uses start and end dates to accurately represent project duration.
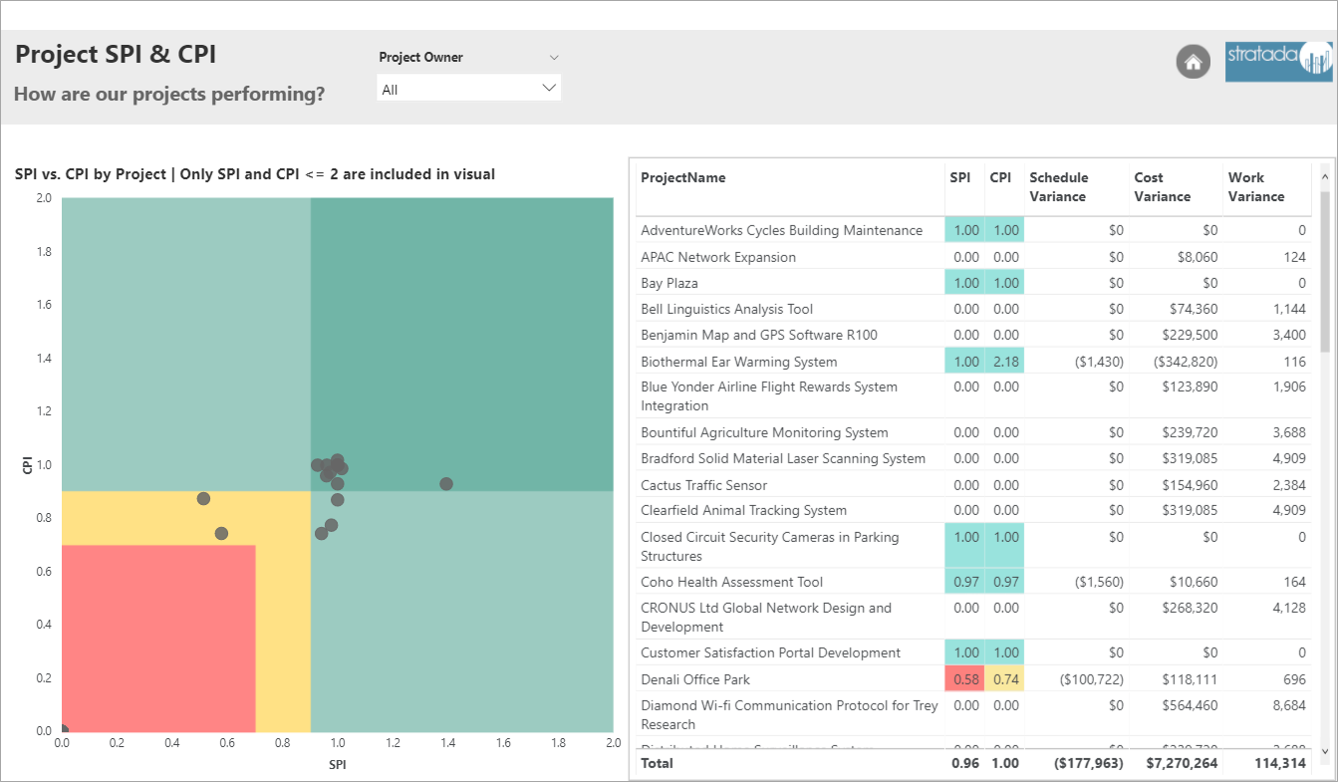
Earned Value Management
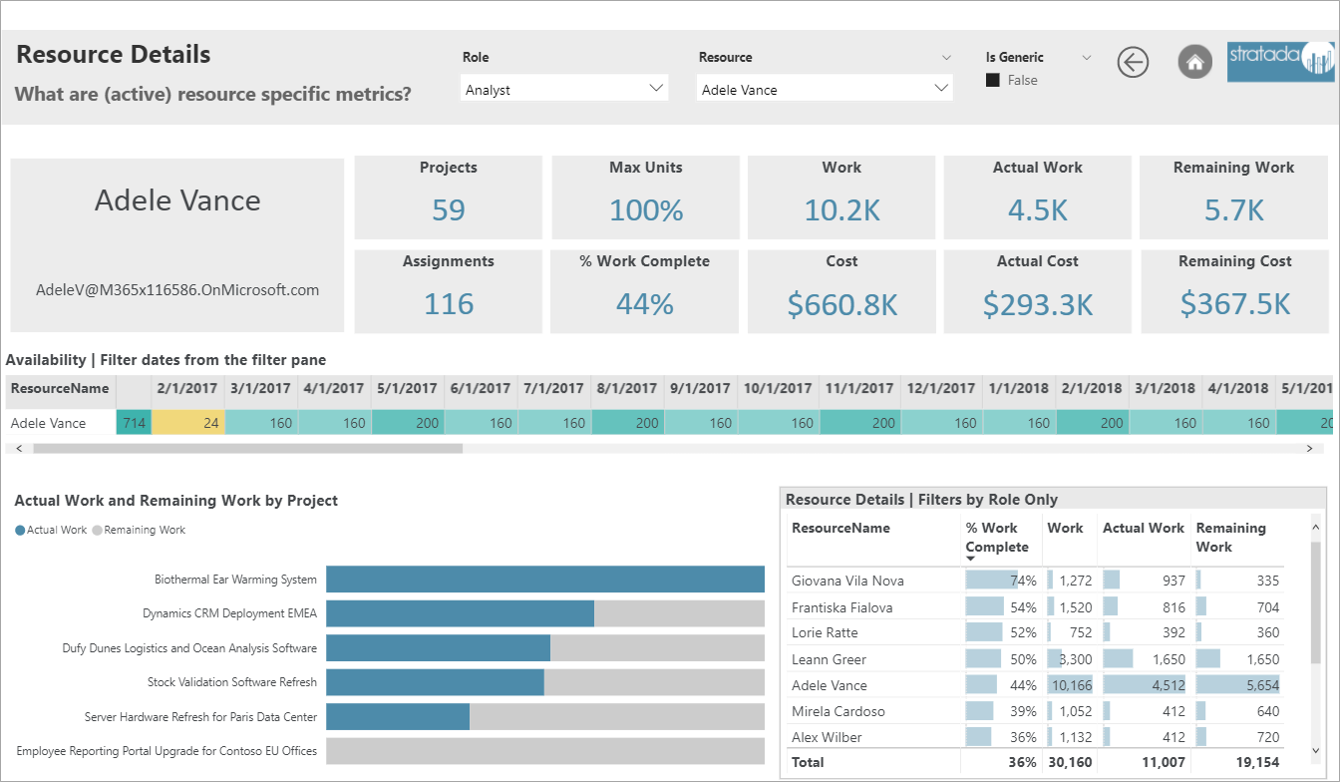
Detailed Analysis
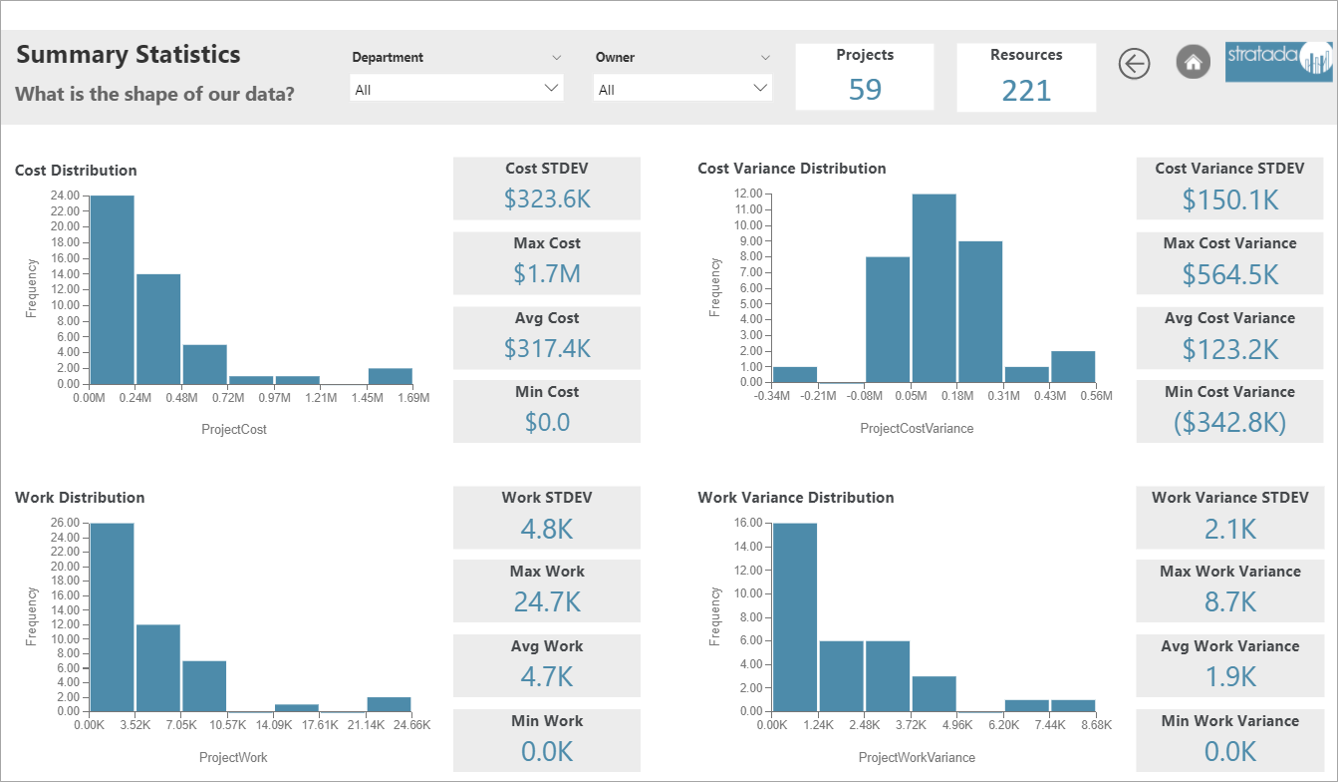
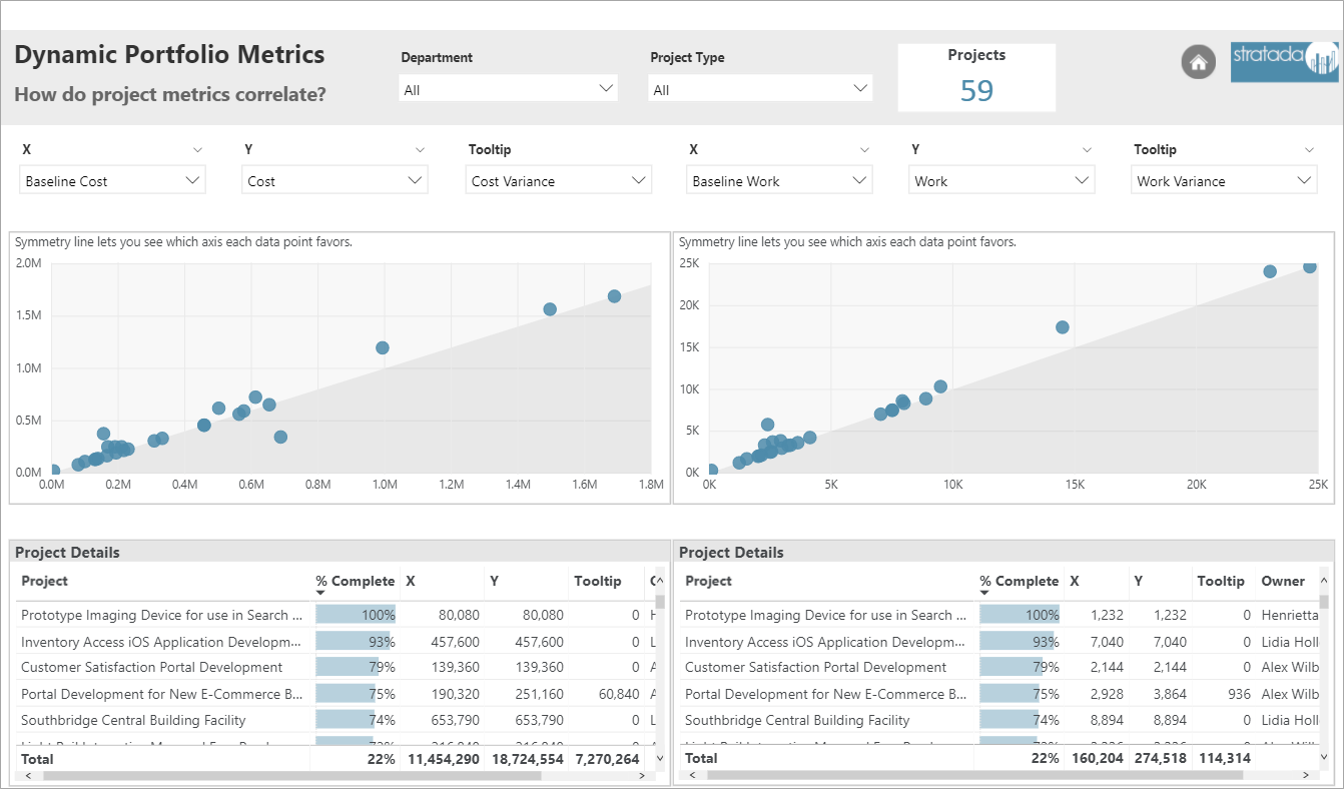
Statistical Analysis
Dynamic Selection
View and interact with our Project Online live reports!
Developing reports and dashboards is both an art and a science. We put deep thought into our report packs so as to deliver a highly valuable product that is both insightful and elegant.
So what’s your data story? We can help you tell it.