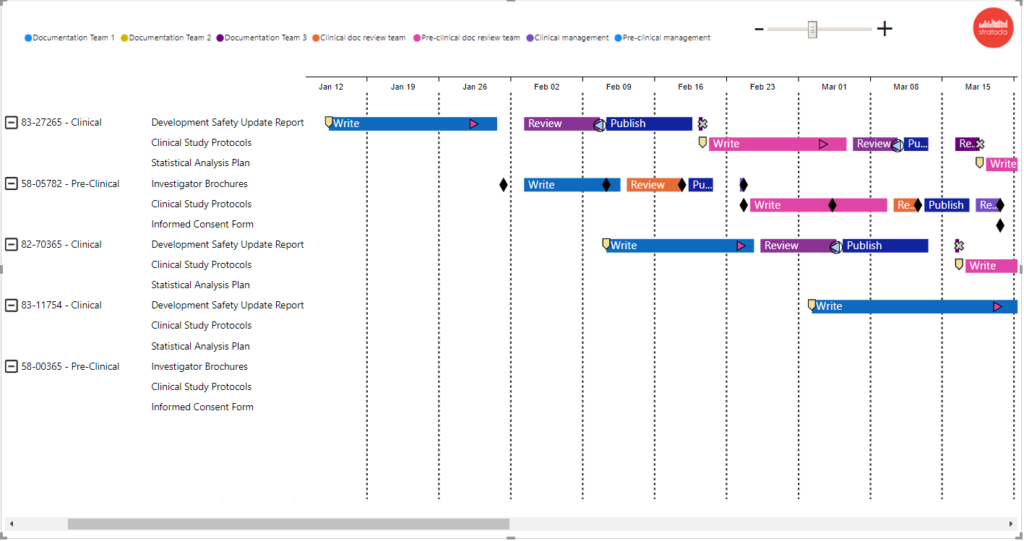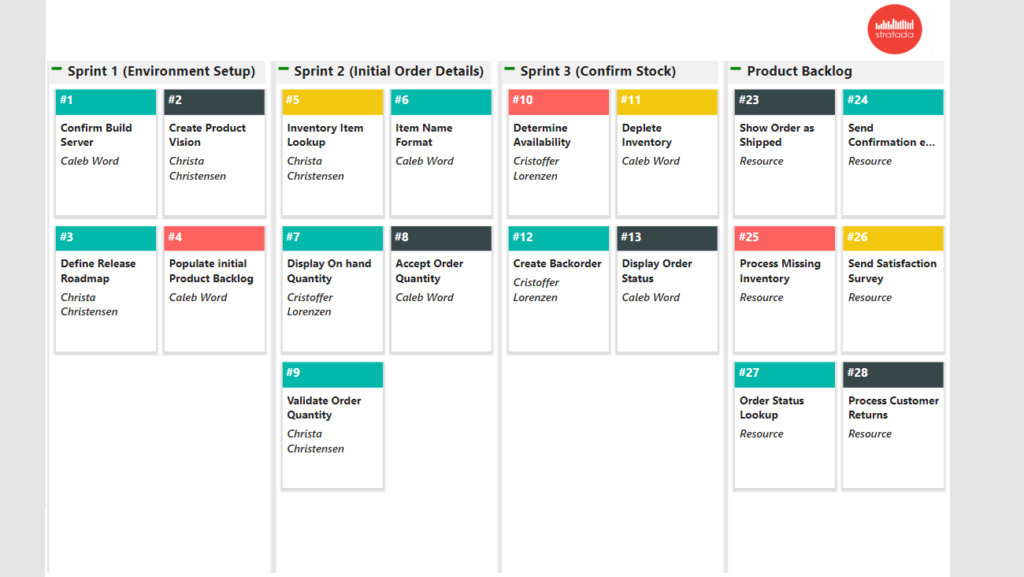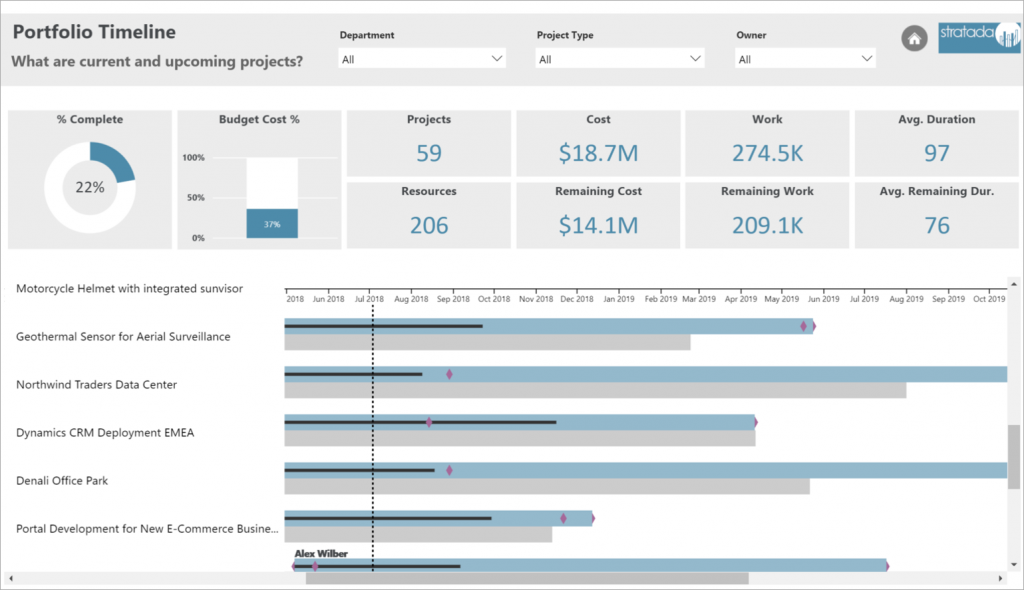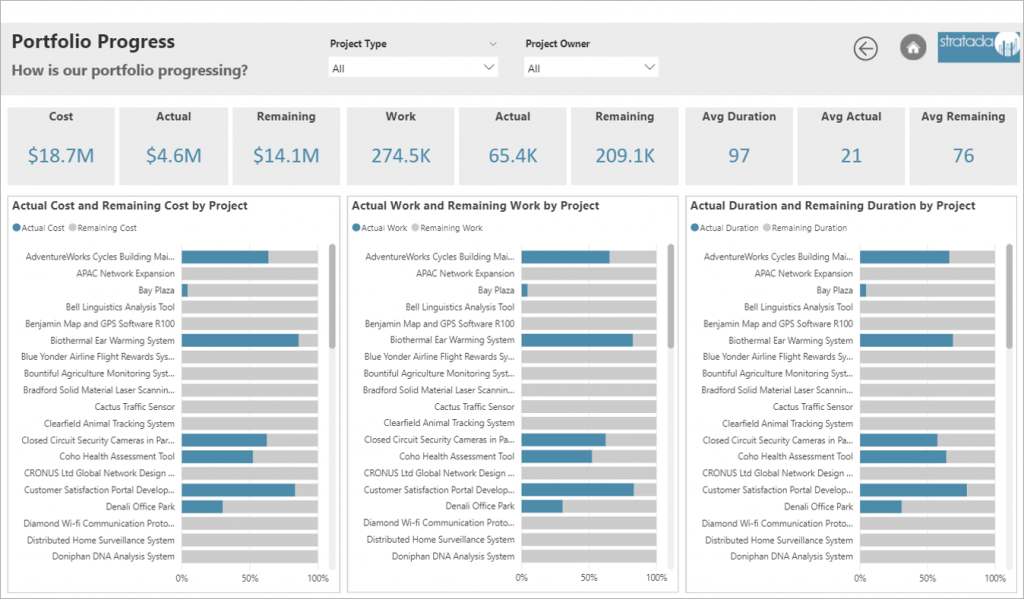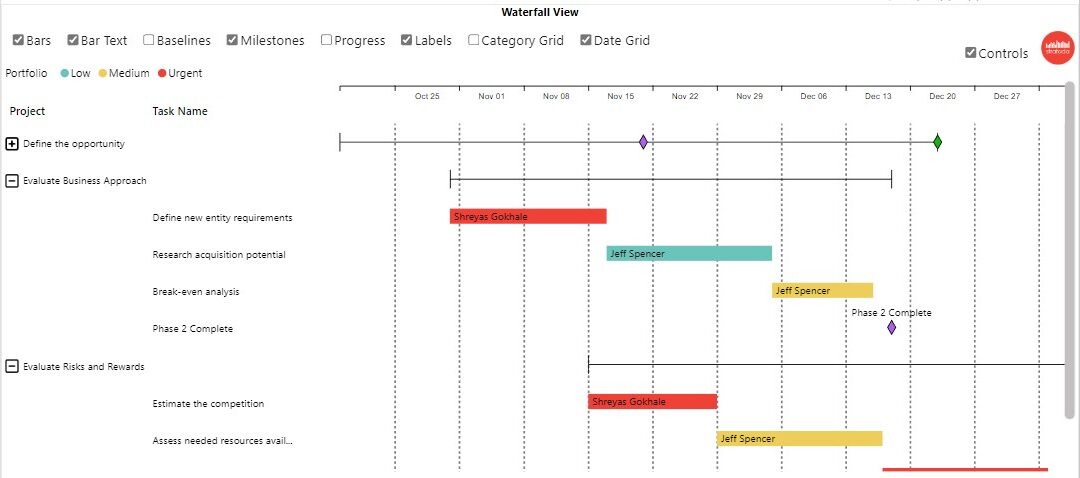
Data Analysis, Power BI, Power BI Custom Visuals, Stratada Timeline for Power BI
In the world of data analytics, Power BI has emerged as a dominant force, offering users a wide array of features that enable seamless data visualization and interpretation. One of the most powerful aspects of Power BI is the ability to create custom visuals that can...

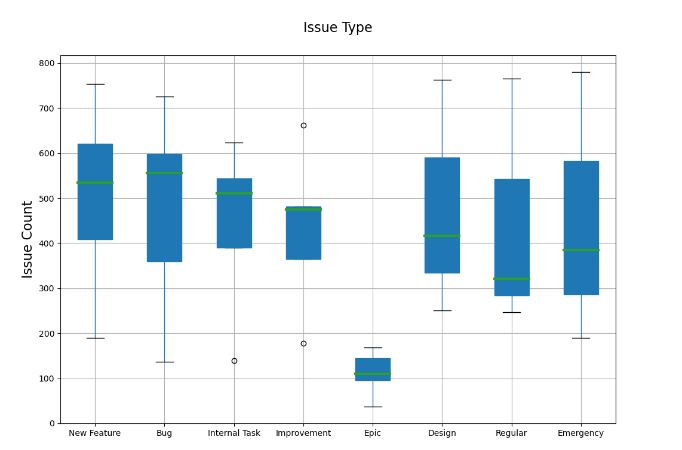
Data Analysis, Machine Learning
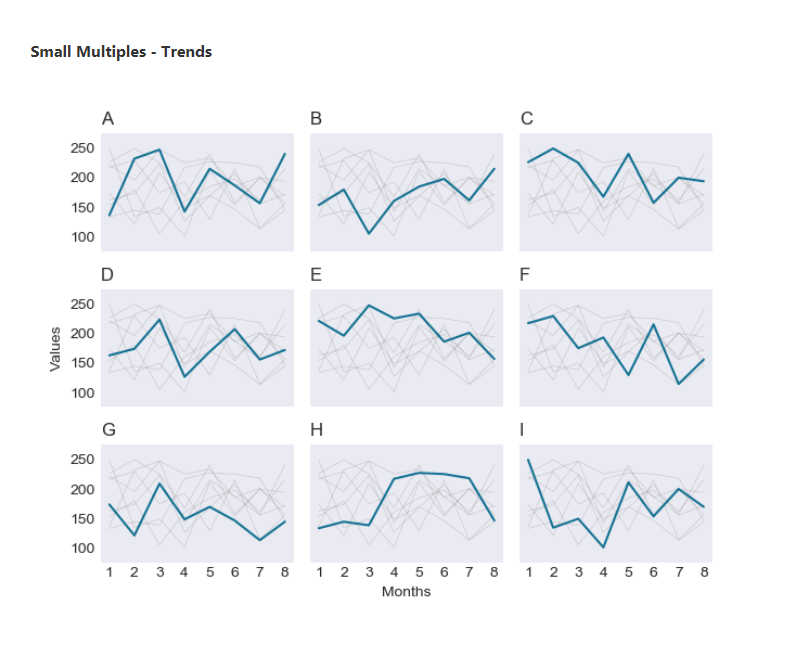
Anomalies are defined as samples that lie at an abnormal distance from other values in the dataset. Anomaly detection (also known as outlier detection) is the process of identifying these observations which differ from the norm. Some use cases for anomaly detection...
Data Analysis, Machine Learning
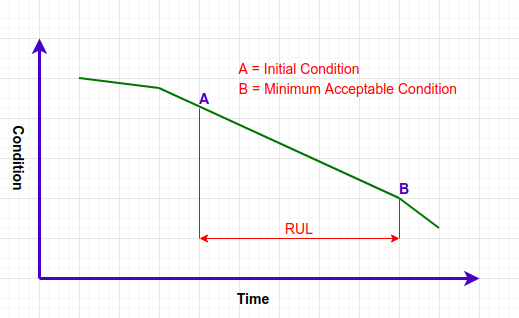
Remaining useful life (RUL) is the amount of time a machine or an asset is likely to operate before it requires repair or replacement. Depending on your system, this time period can be represented in number of Days, Miles, Cycles or any other quantity. RUL prediction...
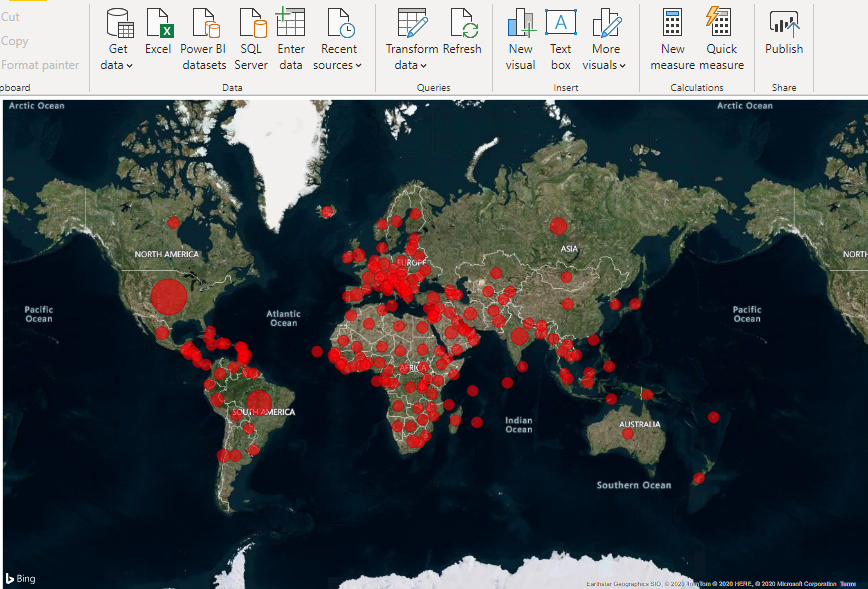
Demos and Webcasts, Power BI, Python, Tricks and Tips
Analysts and developers, proficient in R, have been able to incorporate R visuals in their Power BI projects for quite some time now. It made sense that Microsoft started with R implementation in Power BI, as they acquired Revolution Analytics and its implementation...