
Microsoft Project Online Report Pack
Samples of reports in our Power BI report pack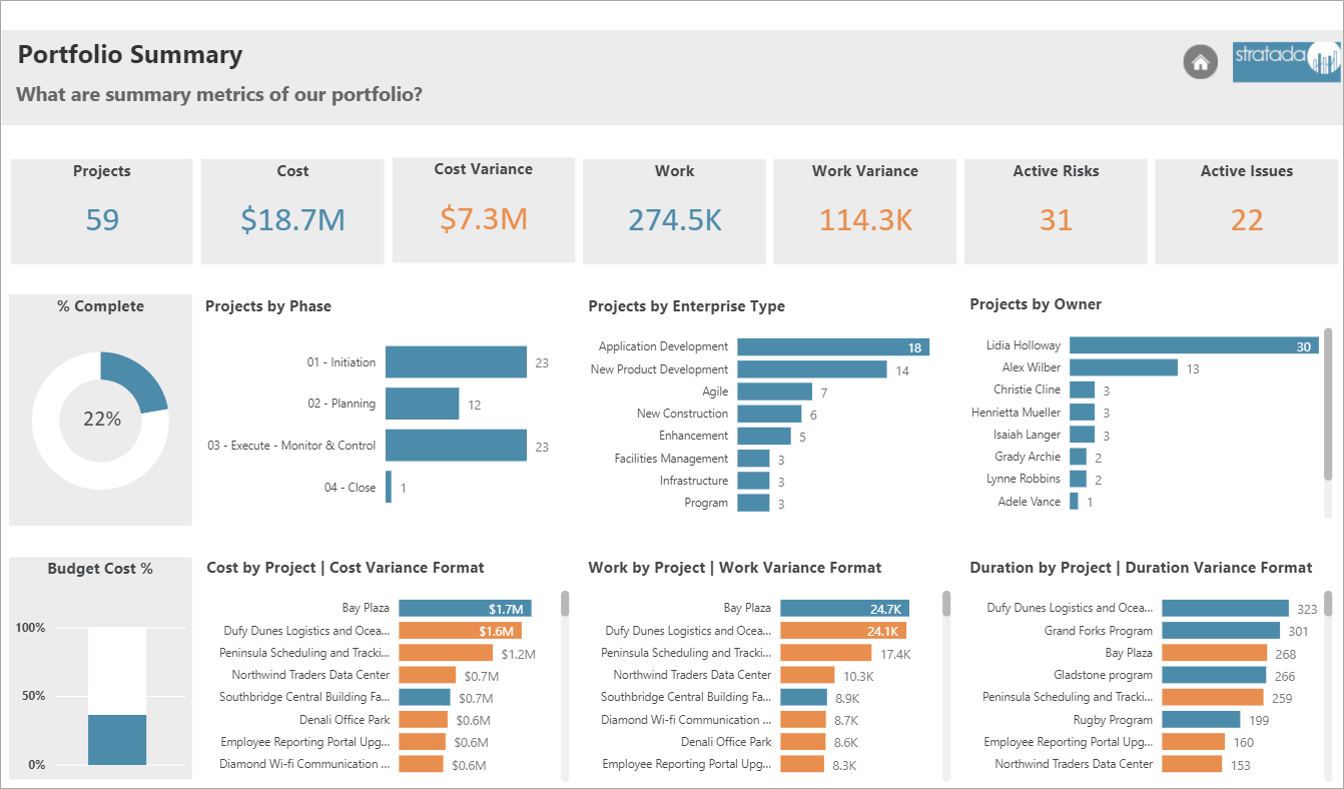
Portfolio Summary
Gain valuable insights with this summarized look into your portfolio. This high-level report provides helpful context into project stats. Key performance indicators alert you to problem areas. Additionally, you can drill through to more detailed reports from this report.
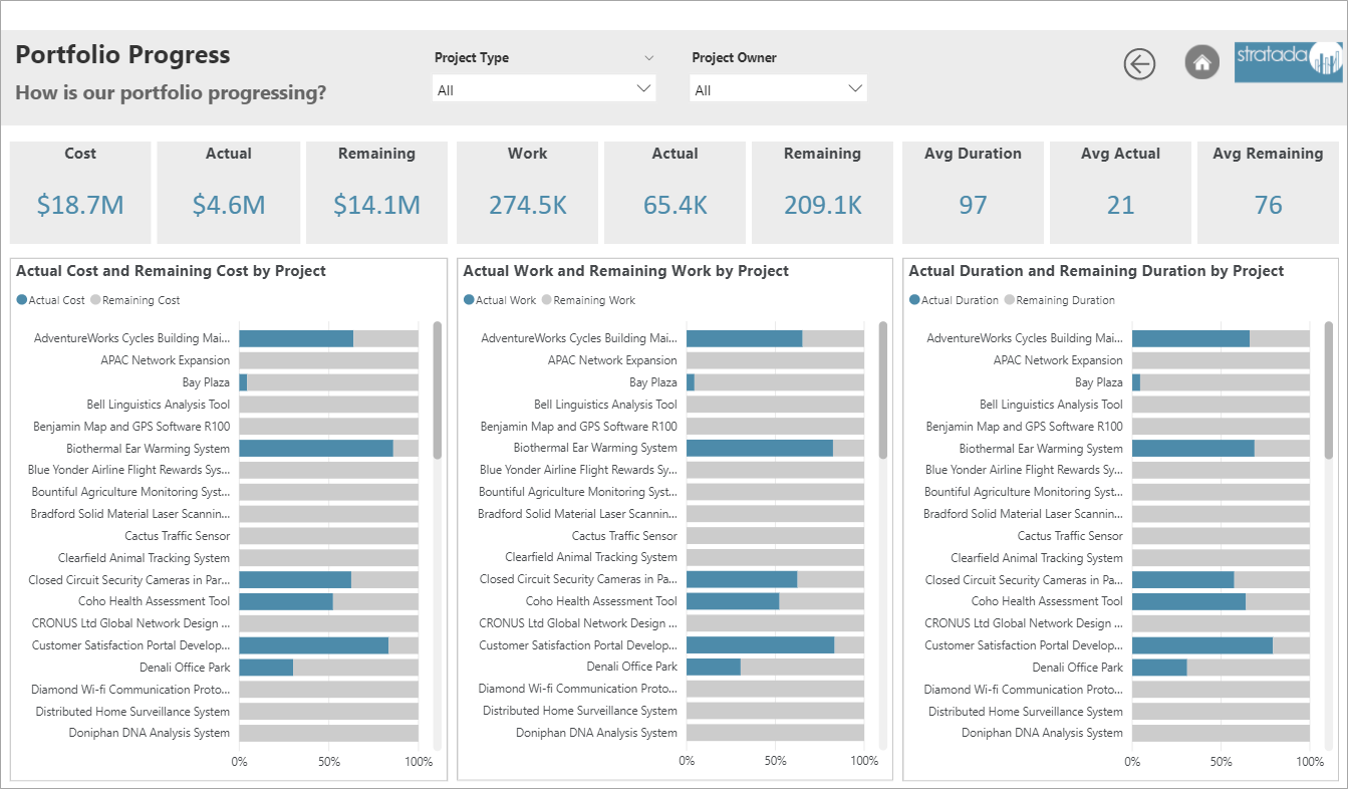
Portfolio Progress
How are projects progressing with cost, work, and duration? A clean and clear layout makes it easy to view individual project metrics. Hover over the bars for tooltips of a specific project. Summarized metrics at the top give insight into your overall portfolio in the areas of cost, work, and duration.
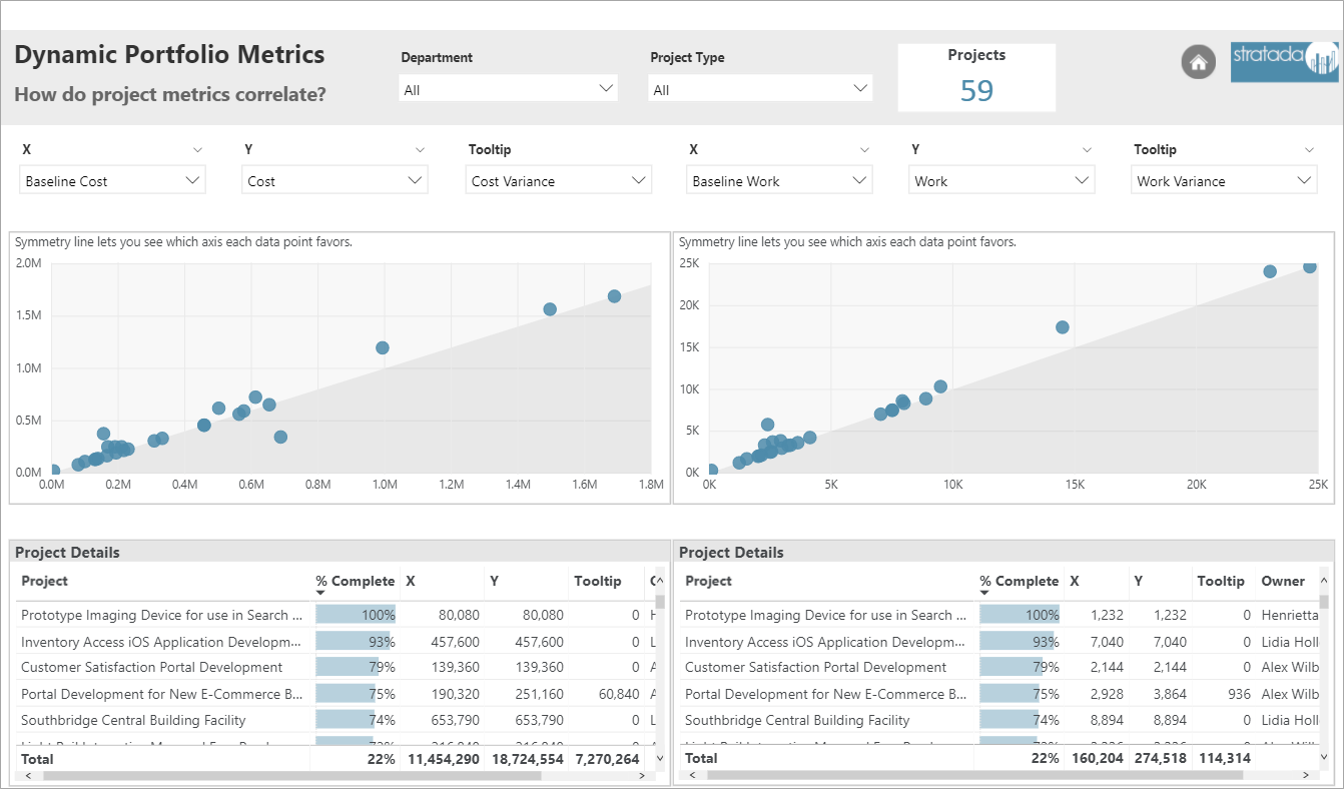
Dynamic Portfolio Metrics
What’s better than a dynamic scatterplot that lets you choose the x-axis, y-axis, and tooltip? Two dynamic scatterplots! That’s right. This report puts the power in your hand. You choose what you see and how you see it. Additionally, the tables update based on your selections.
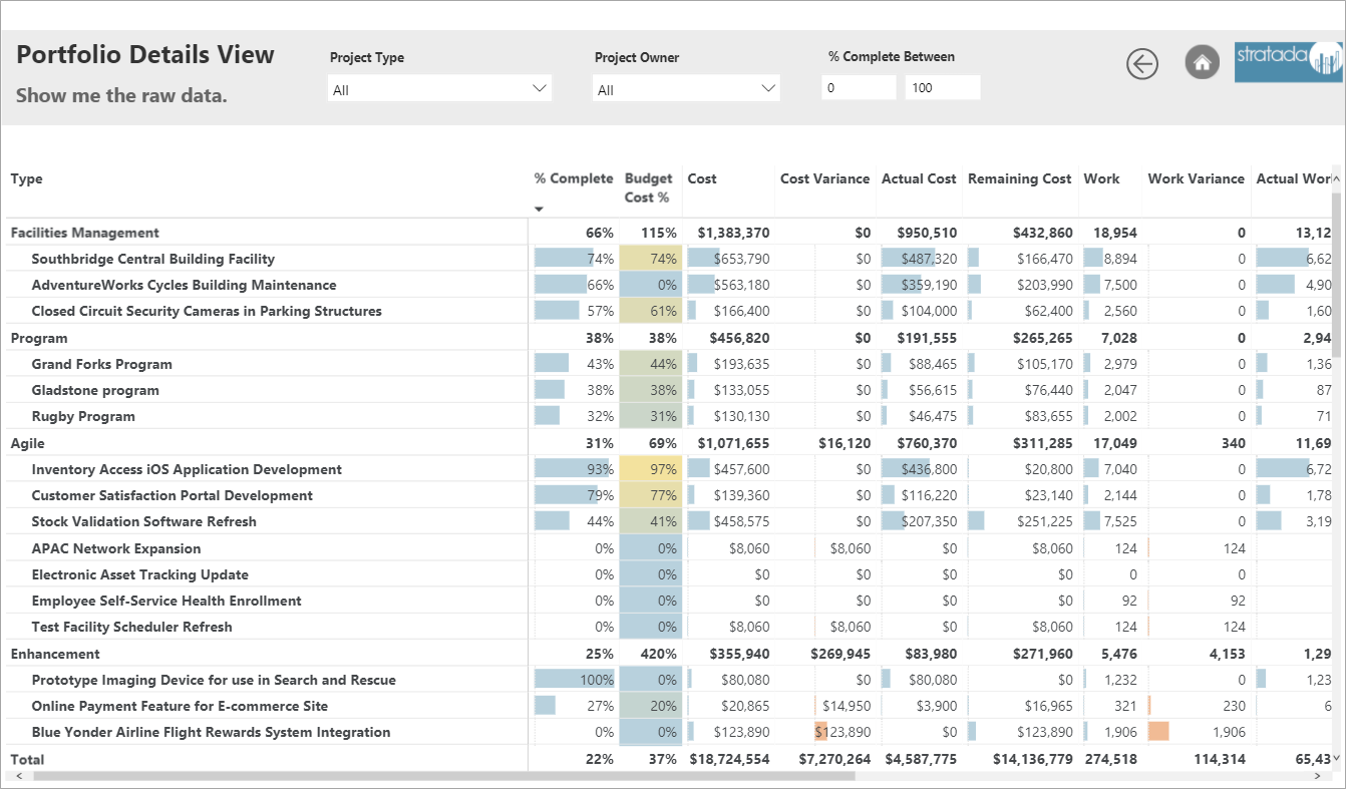
Portfolio Details View
Want to see the details of your portfolio? This report consists of a table with the most important metrics pertaining to cost, work, and duration. Conditional formatting makes it easier to sift through the details. You also have the option to slice the table in various ways.
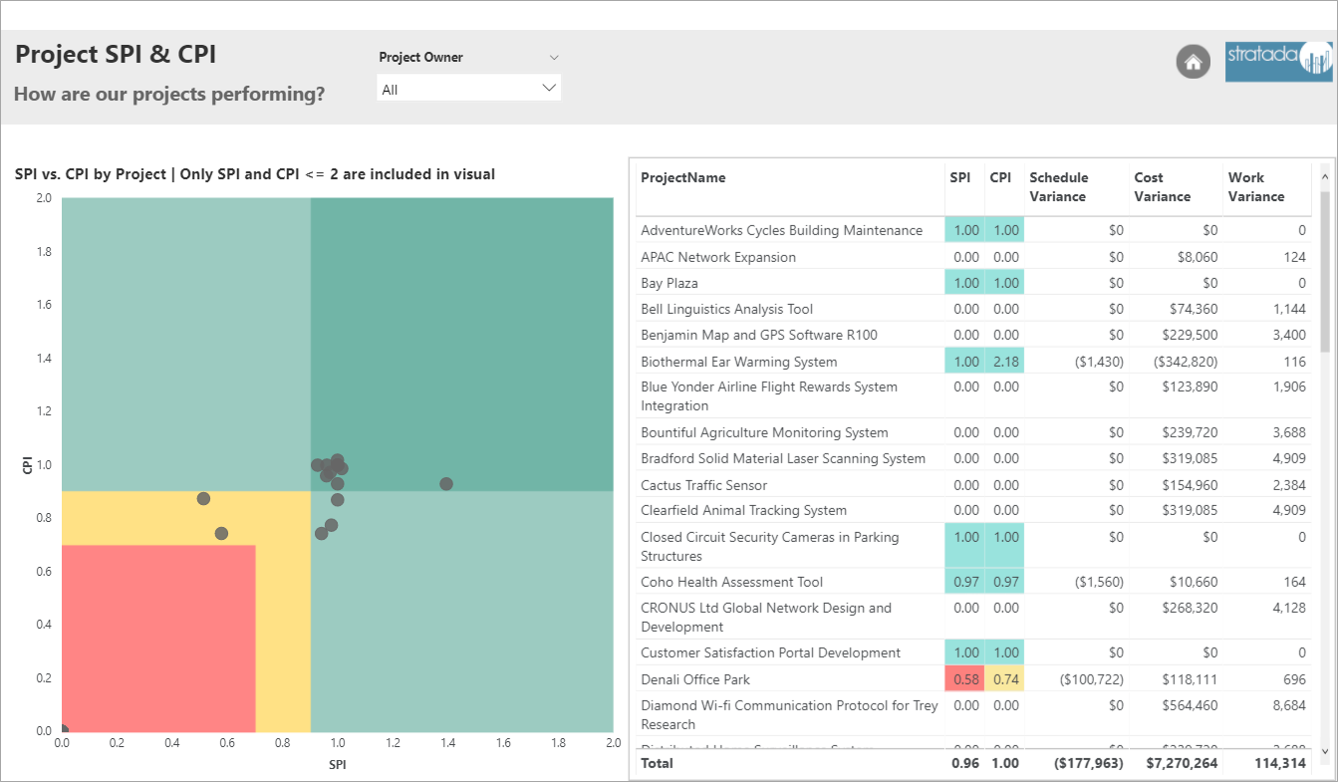
Project SPI & CPI
You don’t see stuff like this very often. That’s because color grids in scatterplots are not built into Power BI. With a little hack, we put together this color-grid scatterplot that makes it easy to interpret project performance. Cross-filter on the scatterplot or slice everything by project owner.
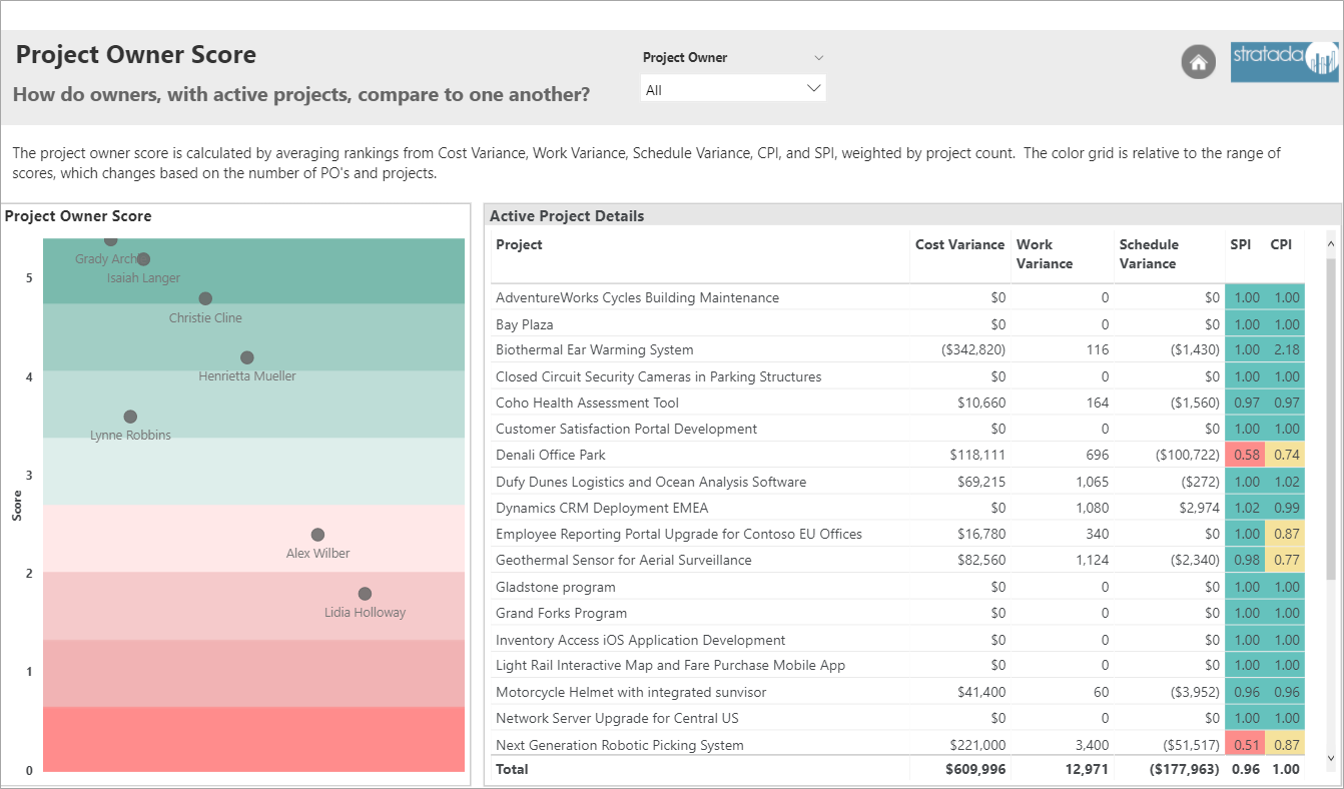
Project Owner Score
This report compares the performance of project owners based on a score that is a weighted average (weighted on the number of projects) of several performance metrics, such as cost variance and work variance. The color-grid in the dot plot allows you to quickly compare scores.
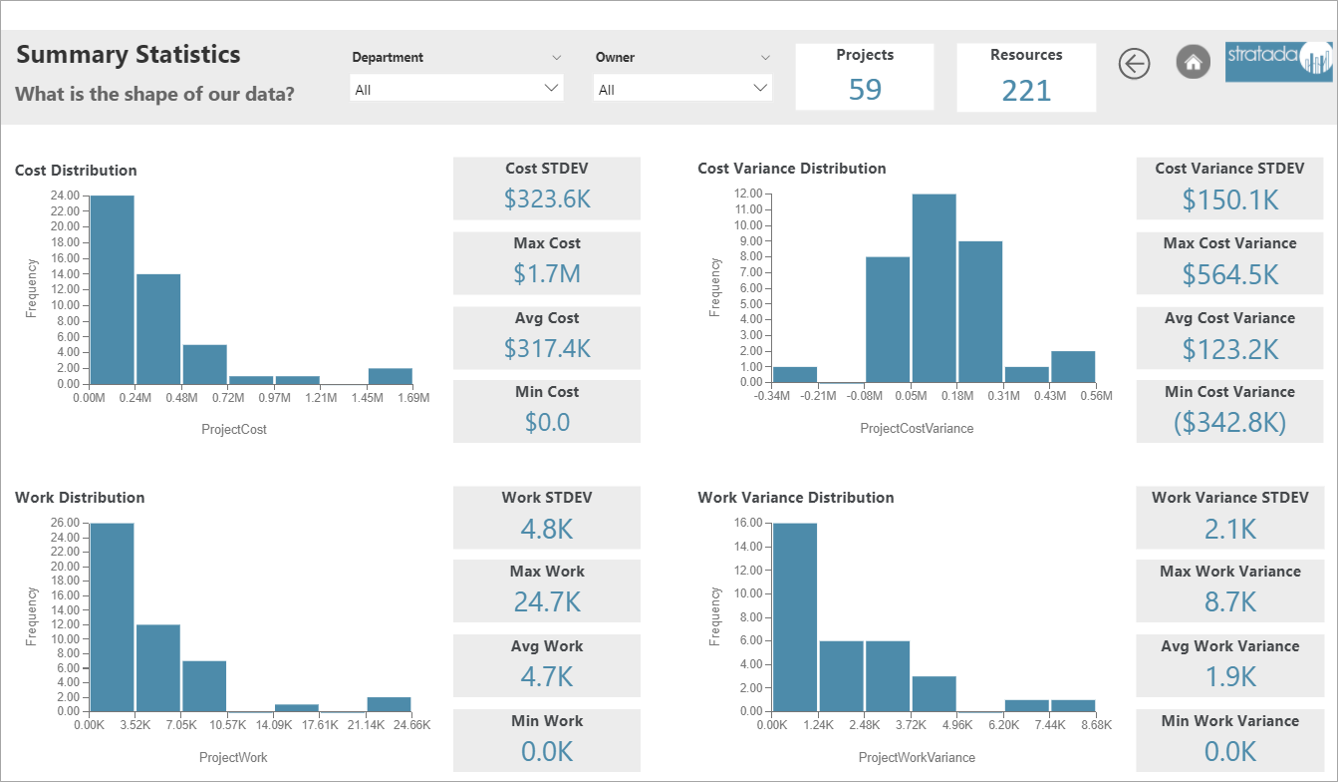
Summary Statistics
This report helps you to see the shape and distribution of your data with the use of histograms and supporting metrics. This is provided for cost, cost variance, work, and work variance. You also have the option to slice the report by department and project owner. Analysts will really like this one!
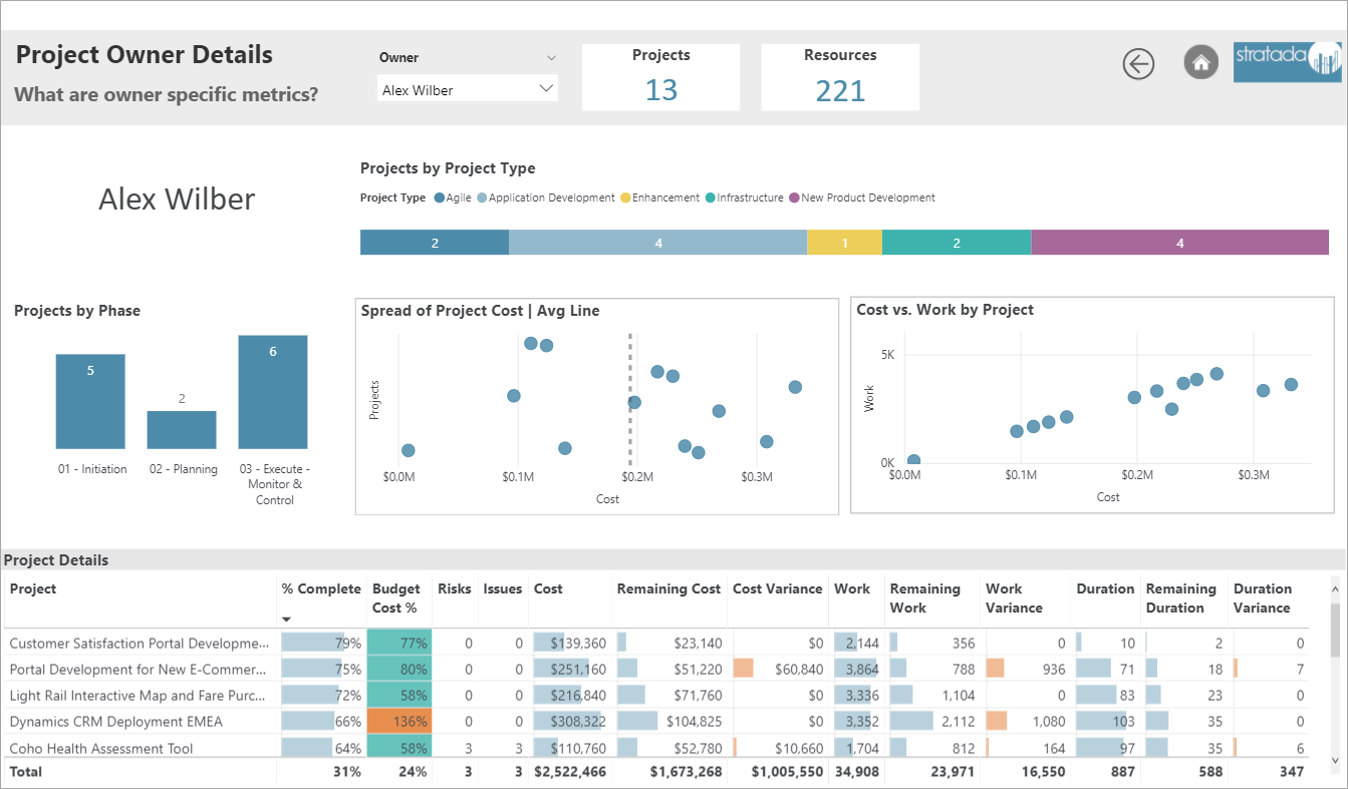
Project Owner Details
Select the project owner for whom you want to see details. This report tells you the number of projects associated with this owner by project type and phase. you can get a close look into the project metrics in the table which uses color formatting for streamlined analysis.
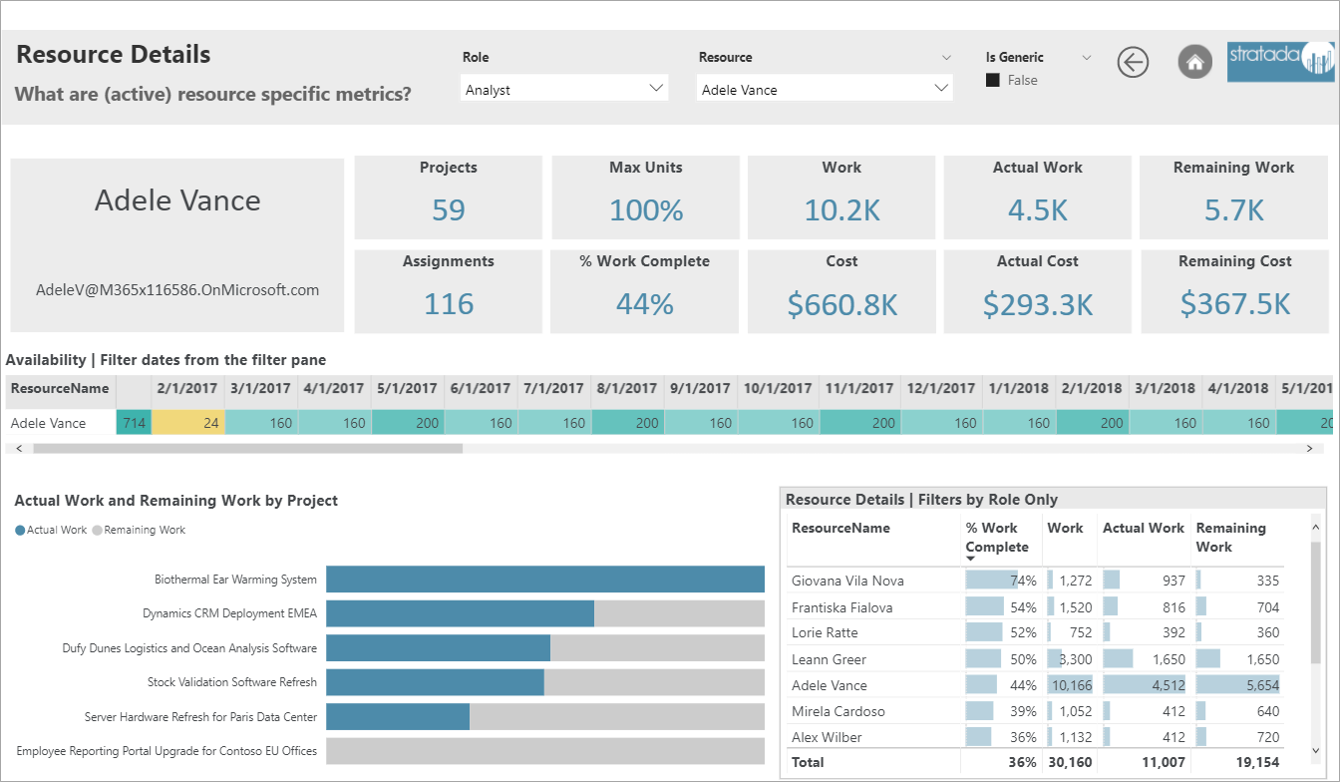
Resource Details
You can slice the report by resource role and then choose which resource you want to see details of. Resource stats are displayed at the top, followed by availability across time and actual vs. remaining work by project. The table is only sliced by resource role, allowing for quick comparisons.