Data Analysis, Power BI, Power BI Custom Visuals, Stratada Timeline for Power BI
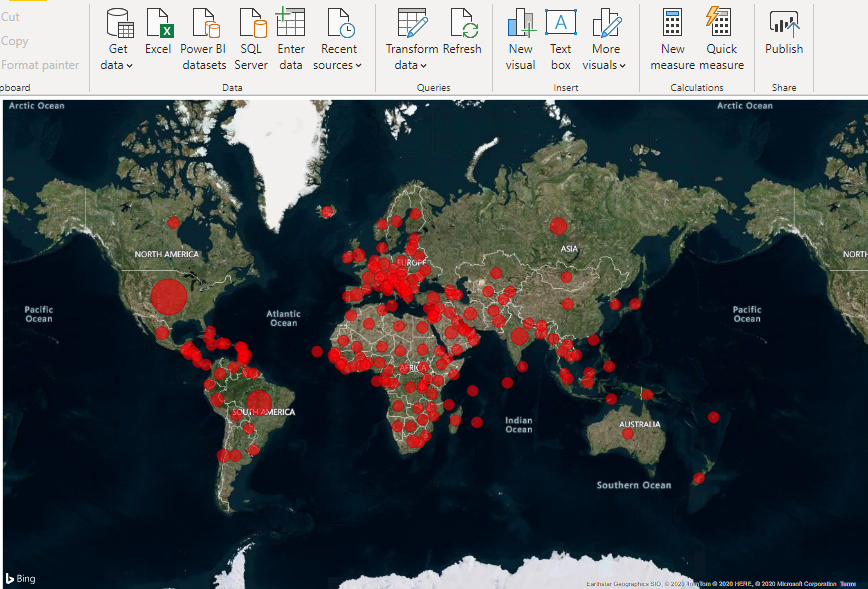
In the world of data analytics, Power BI has emerged as a dominant force, offering users a wide array of features that enable seamless data visualization and interpretation. One of the most powerful aspects of Power BI is the ability to create custom visuals that can...
Power BI, Power BI Custom Visuals
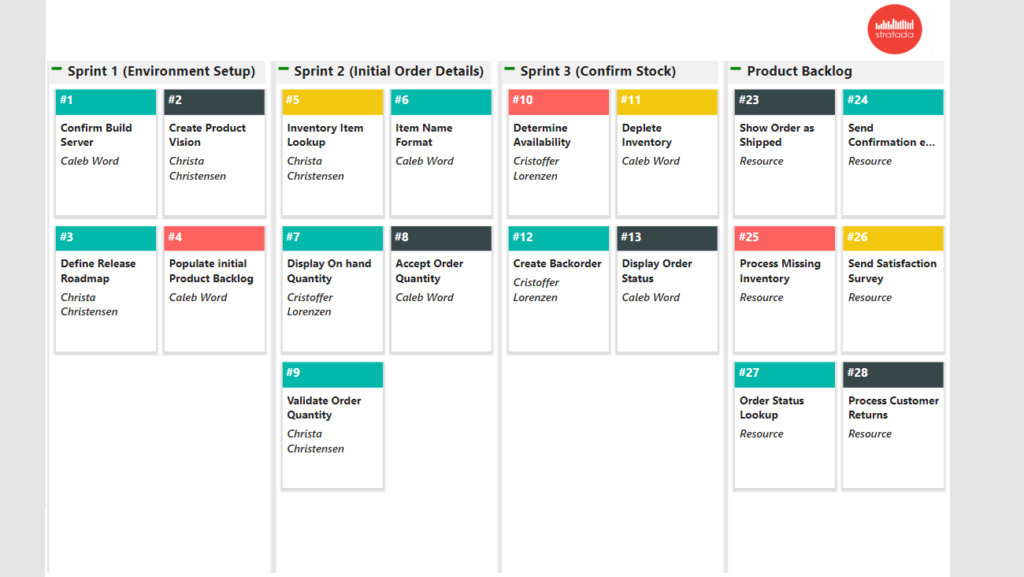
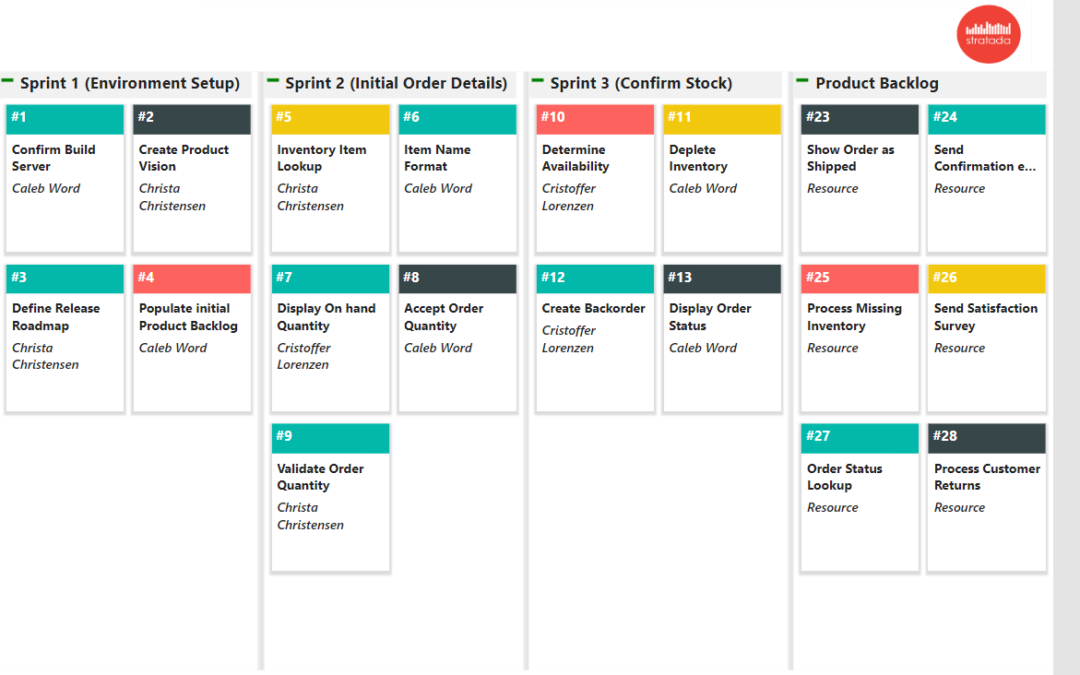
Stratada Program Taskboard for Microsoft Power BI Visualize Your Work The Stratada Taskboard Visual for Microsoft Power BI enables an Agile view. Get a free trial of the Taskboard visual or see purchase plans on Microsoft AppSource here. Z Connect Many data sources...
Power BI, Power BI Custom Visuals, Project Analytics
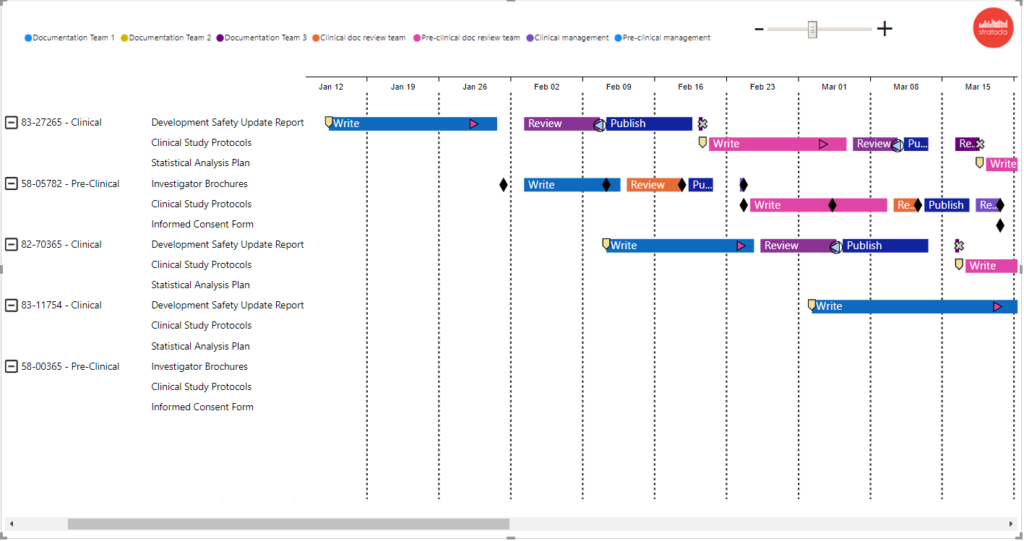
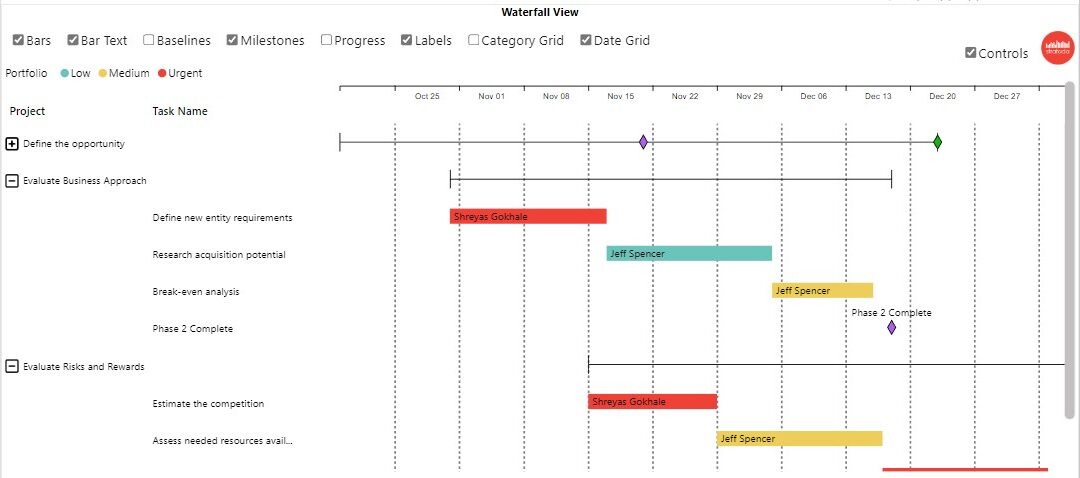
Stratada Gantt Chart for Microsoft Power BI Visualize Your Project The Gantt Chart Visual for Microsoft Power BI has the features you need Z Connect Many data sources are supprted, including Microsoft Project, Dynamics, Atlassian Jira, and many more Communicate...
Power BI, Power BI Custom Visuals, Project Analytics
Stratada Gantt Timeline for Microsoft Power BI Get a free trial of the Timeline visual or see purchase plans on Microsoft AppSource. Many new features are included in this version: Unlimited category levels Categories can now display headers Horizontal category grid...