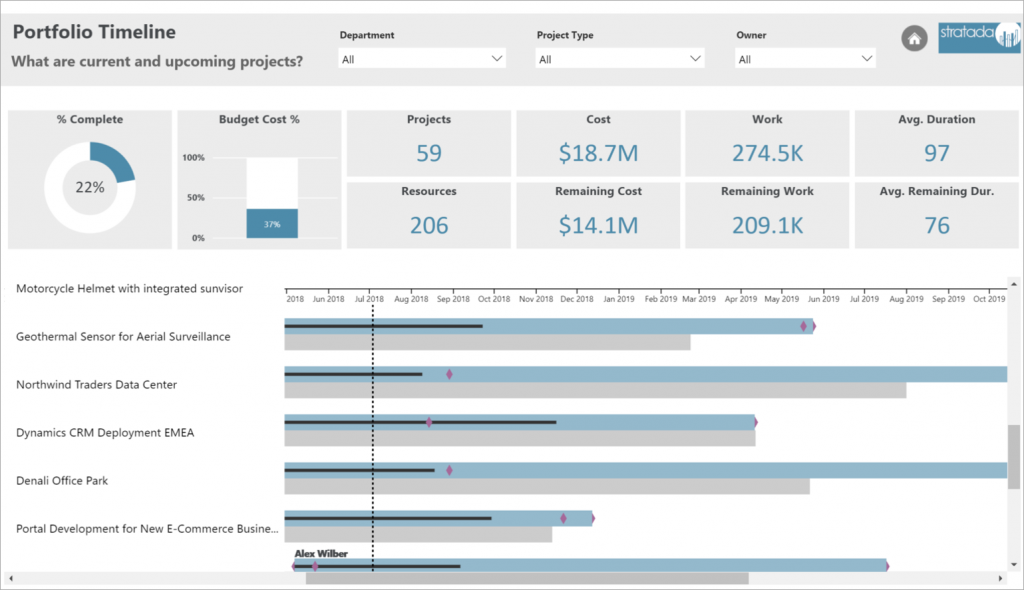
Power BI, Power BI Custom Visuals, Project Analytics
Stratada Gantt Chart for Microsoft Power BI Visualize Your Project The Gantt Chart Visual for Microsoft Power BI has the features you need Z Connect Many data sources are supprted, including Microsoft Project, Dynamics, Atlassian Jira, and many more Communicate...
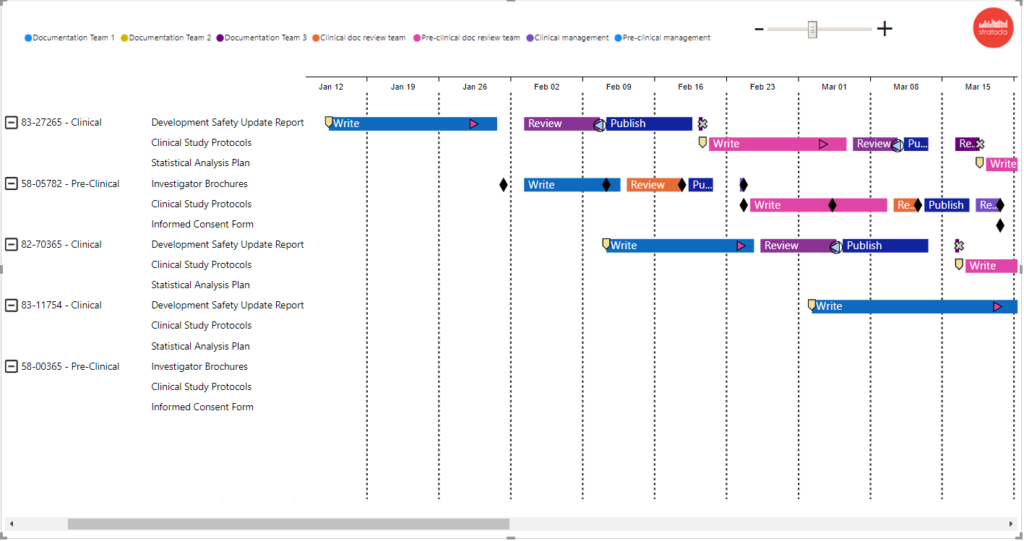
Power BI, Power BI Custom Visuals, Project Analytics
Stratada Gantt Timeline for Microsoft Power BI Get a free trial of the Timeline visual or see purchase plans on Microsoft AppSource. Many new features are included in this version: Unlimited category levels Categories can now display headers Horizontal category grid...
Demos and Webcasts, Project Analytics, Tricks and Tips
https://www.stratada.com/wp-content/uploads/2018/07/buttons_and_bookmarks.mp4 We recently recorded our first webcast on using several key features in Microsoft Power BI to extend and streamline your project analytics (or business analytics, in general). While...